Hardness calculation
There are two hardness calculation models implemented in CENOS. Both models will be described in the chapters below.
How to enable hardness calculation models?
First, you have to make sure that thermal physics is enabled for the domain where you want to calculate hardness. Now you should see also two hardness models and a phase calculation model.
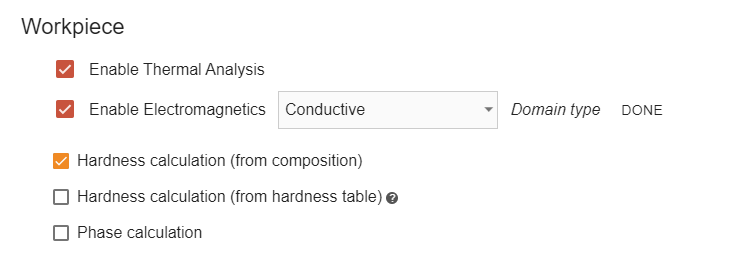
Depending on the chosen models there might be additional information needed.
Model 1: Chemical composition based model
This model is based on empirical formulas considering material alloy composition (C, Mn, Cr, Ni, Mo, V, Si, Cu), austenitization temperature (), and critical cooling rate []. The model was developed using data from more than 500 CCT diagrams. You can read more about it in the papers [1] and [2]. Another parameter used as an input in the Cenos is the end temperature . The end temperature is used to calculate the cooling rate:
Time is counted while the temperature drops from to . In the pre-field materials, we use martensite start temperature () as the end temperature since this temperature is associated with the end of the hardening process or in other words - when all austenite that has not reformed to bainite, pearlite, or ferrite changes its structure to martensitic. Originally model is developed using , but it is left as an optional parameter so the model could be more adjustable to a specific case.
This model can be used only for low-alloy steels! See the limitations in the table below [1]:
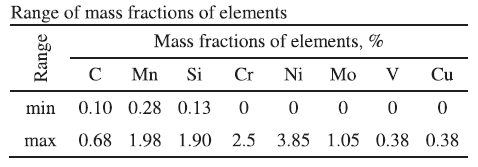
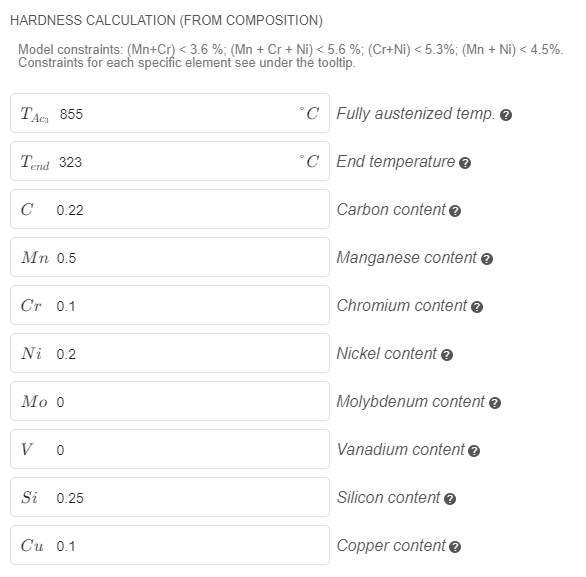
At the top of the hardness model definition, you will see that there are additional constraints for the sum of element concentration in the material.
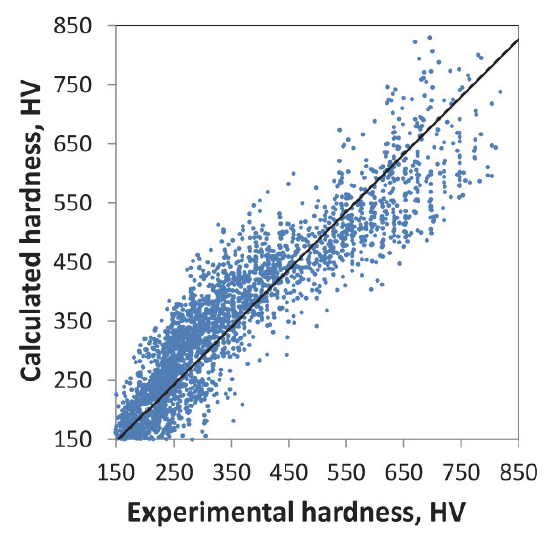
Error values and correlation coefficients for hardness model:
* 48.5 HV mean absolute error
* 38.9 HV standart deviation of the error
* 0.92 R value (see graph below)
Model 2: Hardness calculation from the table
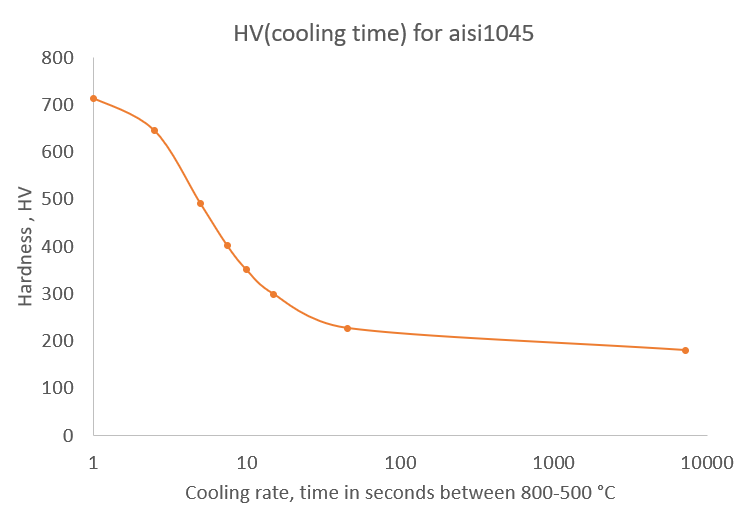
This is a simple model where material hardness is calculated from the hardness depending on cooling time. This data need to be provided in the table format together with austenization temperature and end temperature. End temperature here depends on the table data that you have. In some cases, these tables are given with critical cooling times from 800 to 500 , in this case . A good source for such material properties is Ovako steel navigator https://steelnavigator.ovako.com/heat-treatment-guide/. There you will find similar diagrams to this one:
Other option is to use hardness data that is commonly added to CCT diagrams (continuous-cooling phase change diagrams). You can read the hardness that material has achieved based on the cooling time that has passed beginning at the temperature. Pay attention - in the diagram below hardness is described using different scales - HV and HRC [3].
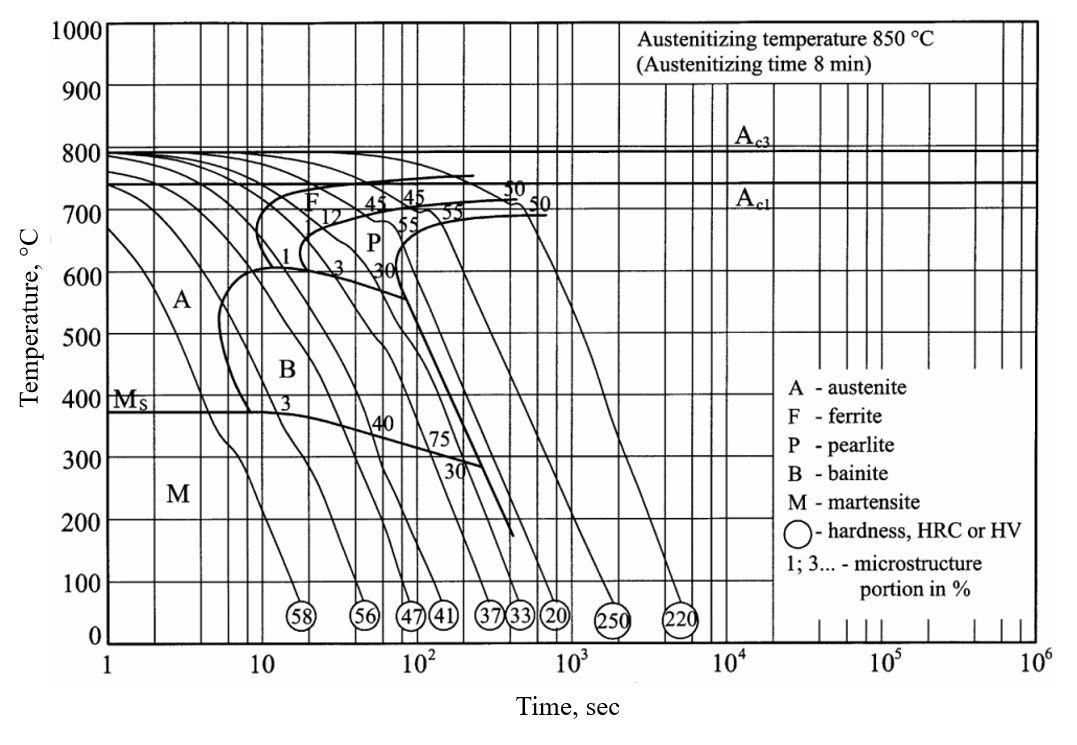
It is important to recalculate the hardness to one scale and use the same units for all data otherwise, the results will be meaningless!
In this case end temperature is equal to the martensite start temperature (). Since the temperature is changing throughout the process we suggest using temperature at the beginning of the process, in this case approximately 380
Here is the preview of the model definition in the Cenos:

Error of calculated hardness depends on the quality of given HV table data.
References
[1] "Empirical formulas for calculating Continuous Cooling Transformation diagrams", J. Trzaska, 2019
[2] "Empirical Formulas for the Calculations of the Hardness of Steels Cooled From the Austenitizing Temperature", J. Trzaska, 2016
[3] "Atlas of steels heat treatment", A. Rose, H. Hougardy, 1972.